Work
mapboxgl-jupyter & mapboxgl-powerbi
Open-source libraries that brought Mapbox to data scientists in Jupyter and analysts in Power BI, two communities the platform hadn't reached.
mapboxgl-jupyter ↗mapboxgl-powerbi ↗
The goal
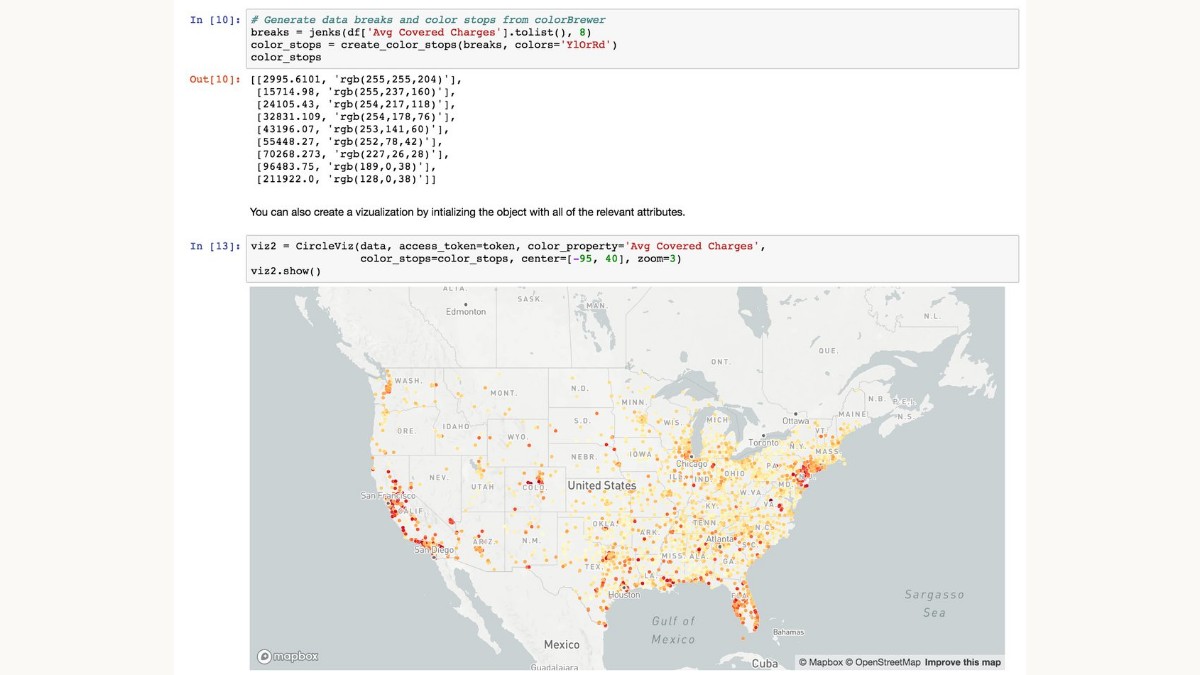
Mapbox's developer base was web and mobile engineers. Two big adjacent audiences, data scientists in Jupyter notebooks and analysts in Power BI, had location data and no good way to map it at scale.
What shipped
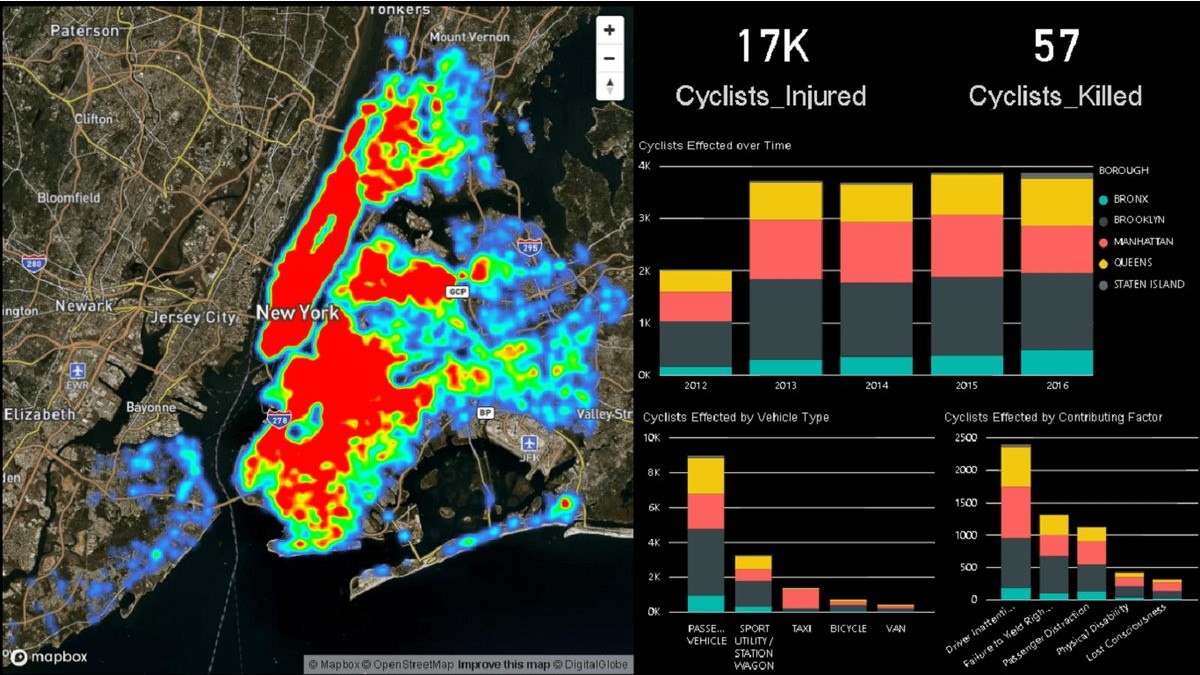
I wrote both libraries. mapboxgl-jupyter brought Mapbox GL visualization into Python notebooks with pandas-native code. mapboxgl-powerbi rendered Mapbox maps natively inside Power BI dashboards. Both were developer advocacy with a product spine: real libraries that closed real workflow gaps.
What I learned
The shortest path to adoption was putting the map inside notebooks and dashboards developers already used.